

The Forms tab
Short answer
The Forms tab adds up the views and submissions of your pop-ups and inline forms inside the time range. Four cards, a chart of submissions per day, week, or month, and a table of every form ranked by submissions.
Open Results in the top bar and choose the Forms tab. Everything on it comes from the views and submissions of your pop-ups and inline forms, in the time range at the top right. Your form pages and link-in-bio pages have a tab of their own; see The Pages tab.
Change the range and the numbers follow it; only Published forms stays the same. What the Forms tab counts says what a view and a submission are.
The four cards
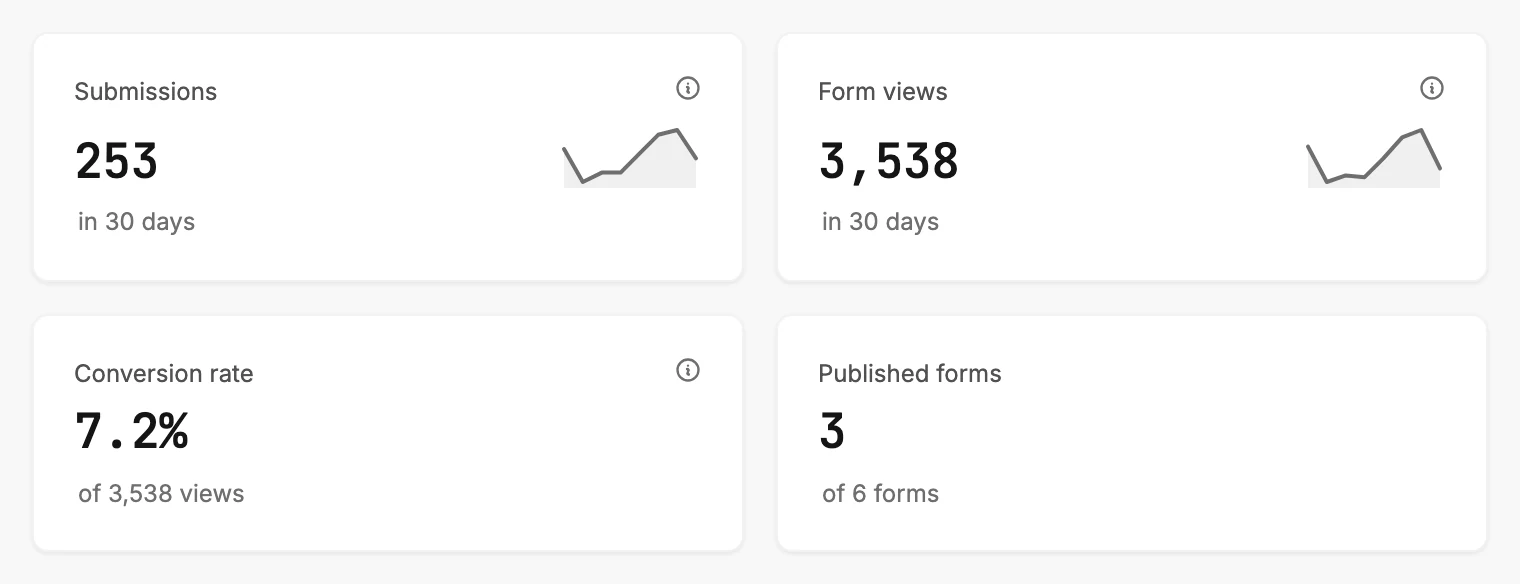
| Card | The number | The line under it |
|---|---|---|
| Submissions | People who joined through a form in the range. | The change against the period before, as +12% vs prior 30 days. |
| Form views | Visits to your live forms in the range. | The change against the period before, the same way. |
| Conversion rate | Submissions as a share of views, for the range. | The views behind it, as of 2,626 views. |
| Published forms | How many of your forms are live. | Out of how many you have, as of 3 forms. |
Three cards carry an ⓘ. Rest your pointer on one to read it, or tap it on a phone.
Submissions reads Form signups that became contacts. Newly tracked, so the count builds as submissions come in. Form views reads Unique visits to your published forms. Newly tracked, so the count builds as visits come in. Conversion rate reads Submissions divided by form views, for this period.
Jounce began counting views and submissions on a set day, so anything earlier isn’t here. When Submissions reads lower than the signups you got, see Why is Submissions lower than the signups I got?
When the period before the range had nothing to compare against, the line under Submissions or Form views reads in 30 days alone. With a change to show, an arrow points up or down beside it.
A rise in Submissions is green and a fall is red. The change in Form views stays grey, because a jump in visits can be a campaign or a bot.
Submissions and Form views each carry a small line beside the number. It traces the last few bars of the chart below.
Conversion rate reads a dash until there are views to divide by, and its line reads Needs a view first. It also waits when submissions outnumber views. See Dashes, plus signs, and the As of line.
With more than 500 forms and pages, a line under the cards reads This view covers 500 of your forms and pages, and each count wears a plus sign.
Submissions over time
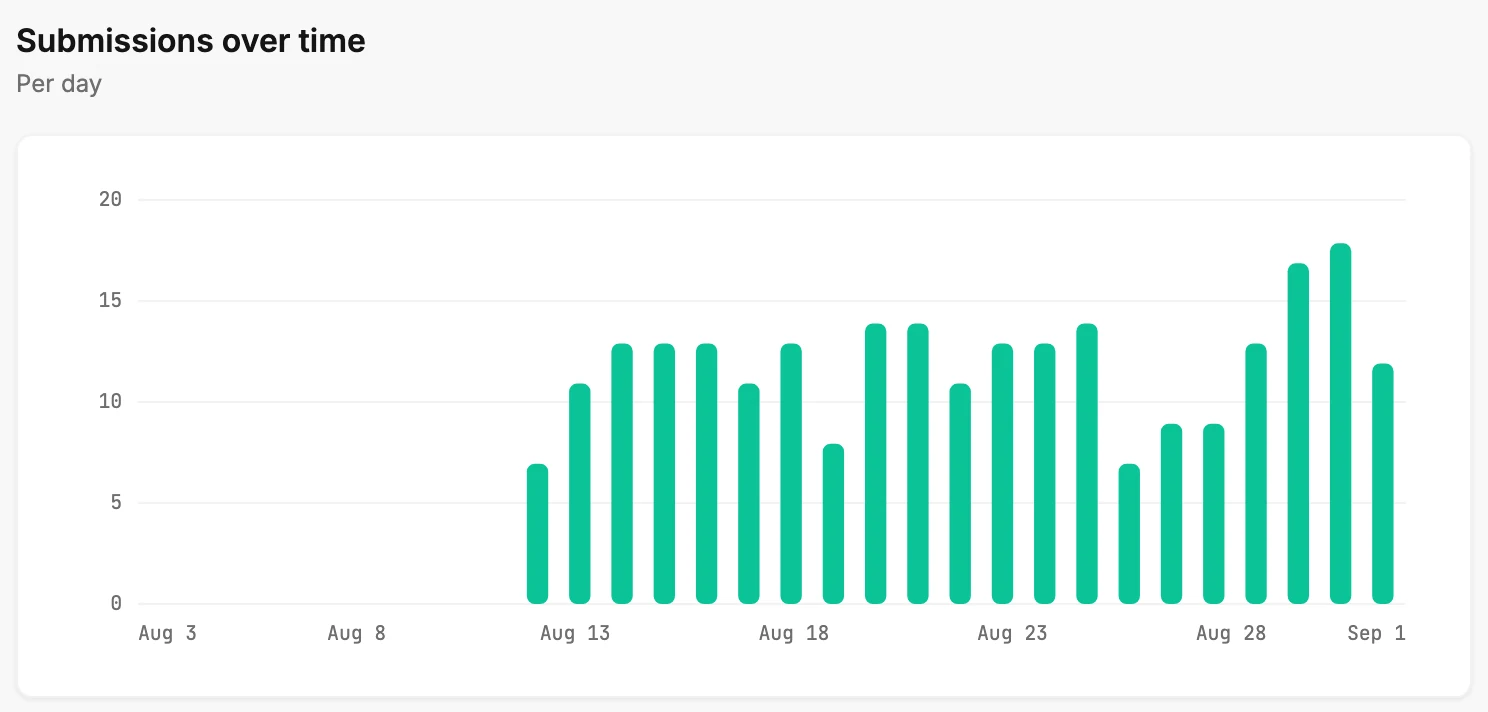
A bar chart of submissions across the range. The note beside the heading says what one bar is: Per day for 7 or 30 days, Per week for 90 days, Per month for 12 months.
Rest your pointer on a bar to read its date and count. The last bar is the period still in progress. Days start and end at midnight Pacific time, which may not be your local midnight.
With no submission in the range, a line takes the chart’s place: No form submissions in the last 30 days yet.
Your forms
The last section is a table of every pop-up and inline form, ranked by submissions: the form’s name, its status, and its views, submissions, and conversion inside the range. See The Your forms table. A form you can’t find there is explained in Why isn’t my form in the Your forms table?
When there is nothing to show
With no form in the workspace, the tab shows one line, No forms yet. Under it: Create a signup form and publish it, and it’ll show up here, with a Create form button.
If you have pages but no forms, it reads Nothing for your website yet and Your form pages and links in bio are in Pages. See Why is a Results tab empty?
When the numbers can’t be fetched, a card reads Couldn’t load your form results with a Try again button. Your forms are safe. See Why won’t Results load?
More in this topic
Also answered here
- what does conversion rate mean on results
- where do I see form submissions across all my forms
- what does newly tracked mean on the forms tab
Updated